Endothermic and
Exothermic Reactions
Many chemical reactions give off energy. Chemical reactions that release energy are called exothermic reactions. Some chemical reactions absorb energy and are called endothermic reactions. You will study one exothermic and one endothermic reaction in this experiment.
In Part I, you will study the reaction between citric acid solution and baking soda. An equation for the reaction is:
H3C6H5O7(aq) + 3 NaHCO3(s) → 3 CO2(g) + 3 H2O(aq) + Na3C6H5O7(aq)
In Part II, you will study the reaction between magnesium metal and hydrochloric acid. An equation for this reaction is:
Mg(s) + 2 HCl(aq)→ H2(g) + MgCl2(aq)
Another objective of this experiment is for you to become familiar with using LabQuest. In this experiment, you will use the program to collect and display data as a graph or list, to examine your experimental data values on a graph, and to print graphs and data lists.
OBJECTIVES
In this experiment, you will
• Study one exothermic and one endothermic reaction.
• Become familiar with using LabQuest App.
• Collect and display data on a graph.
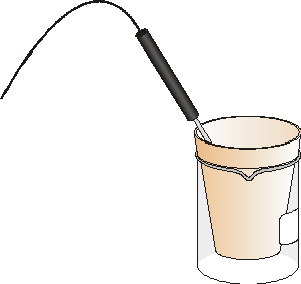
Figure 1
MATERIALS
LabQuest |
250 mL beaker |
LabQuest App |
citric acid, H3C6H5O7, solution |
Temperature Probe |
baking soda, NaHCO3 |
50 mL graduated cylinder |
hydrochloric acid, HCl, solution |
balance |
magnesium, Mg |
Styrofoam cup |
|
PROCEDURE
1. Obtain and wear goggles.
Part I Citric Acid plus Baking Soda
2. Connect the Temperature Probe to LabQuest.
3. Place a Styrofoam cup into a 250 mL beaker as shown in Figure 1. Measure out 30 mL of citric acid solution into the Styrofoam cup. Place the Temperature Probe into the citric acid solution.
4. Weigh out 10.0 g of solid baking soda on a piece of weighing paper.
5. Press the power button on LabQuest to turn it on. Choose New from the File menu. If you have an older sensor that does not auto-ID, manually set up the sensor by choosing Sensor Setup from the Sensors menu.
6. On the Meter screen, tap Rate. Change the data-collection rate to 0.5 samples/second (interval of 2 seconds/sample) and the data-collection length to 300 seconds. Select OK.
7. You are now ready to begin collecting data.
a. Start data collection.
b. After about 20 seconds have elapsed, add the baking soda to the citric acid solution. Gently stir the solution with the Temperature Probe to ensure good mixing.
c. A real-time graph of temperature vs. time will be displayed on the screen during data collection.
d. Temperature readings (in °C) can also be monitored in a display box to the right of the graph.
8. Dispose of the reaction products as directed by your instructor.
9. When data collection is complete, a graph of temperature vs. time will be displayed. To examine the data pairs on the displayed graph, tap any data point. As you tap each data point, its temperature and time values are displayed in the display box to the right of the graph. Note: You can also advance the examine cursor point by point using the ► or ◄ keys on LabQuest. Determine the initial temperature, t1 and final (or minimum) temperature, t2. Record the temperature values in your data table.
10. Store the data from the first run so that it can be used later by tapping the File Cabinet icon.
Part II Hydrochloric Acid Plus Magnesium
11. Measure out 30 mL of HCl solution into the Styrofoam cup. Place the Temperature Probe into the HCl solution. Note: The Temperature Probe must be in the HCl solution for at least 30 seconds before doing Step 13.
12. Obtain a piece of magnesium metal from your instructor.
13. Start data collection. After about 20 seconds have elapsed, add the Mg to the HCl solution. Gently stir the solution with the Temperature Probe to ensure good mixing. Caution: Do not breathe the vapors. Data collection will stop after 5 minutes.
14. Dispose of the reaction products as directed by your instructor. Rinse the Temperature Probe.
15. When data collection is complete, a graph of temperature vs. time will be displayed. Examine the data points along the displayed curve. Determine the initial temperature, t1, and the final (or maximum) temperature, t2. Record the temperature values in your data table.
16. You can also examine the data by viewing the data table.
a. Tap the Table tab to view the data table. The data Part I and Part II will be displayed.
b. Tap the Graph tab to return to the graph when you have finished viewing the data table.
17. A good way to compare the two curves is to view both sets of data on one graph.
a. On the Graph tab, tap Run 2 in the upper-right corner of the screen.
b. Select All Runs. Both temperature runs should now be displayed on the same graph.
18. (optional) Print a graph of temperature vs. time (with two curves displayed). On your paper copy, label each curve as “endothermic reaction” or “exothermic reaction”.
DATA TABLE
|
Part I |
Part II |
Final temperature, t2 |
°C |
°C |
Initial temperature, t1 |
°C |
°C |
Temperature change, ∆t |
°C |
°C |
Processing the data
1. Calculate the temperature change, ∆t, for each reaction by subtracting the initial temperature, t1, from the final temperature, t2 (∆t = t2 – t1).
2. Tell which reaction is exothermic. Explain.
3. Which reaction had a negative ∆t value? Is the reaction endothermic or exothermic? Explain.
4. For each reaction, describe three ways you could tell a chemical reaction was taking place.
5. Which reaction took place at a greater rate? Explain your answer.