Vapor Pressure of Liquids
In this experiment, you will investigate the relationship between the vapor pressure of a liquid and its temperature. When a liquid is added to the Erlenmeyer flask shown in Figure 1, it will evaporate into the air above it in the flask. Eventually, equilibrium is reached between the rate of evaporation and the rate of condensation. At this point, the vapor pressure of the liquid is equal to the partial pressure of its vapor in the flask. Pressure and temperature data will be collected using a Pressure Sensor and a Temperature Probe. The flask will be placed in water baths of different temperatures to determine the effect of temperature on vapor pressure. You will also compare the vapor pressure of two different liquids, ethanol and methanol, at the same temperature.
OBJECTIVES
In this experiment, you will
• Investigate the relationship between the vapor pressure of a liquid and its temperature.
• Compare the vapor pressure of two different liquids at the same temperature.
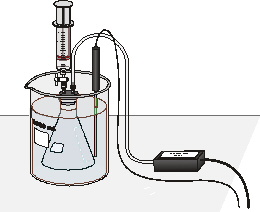
Figure 1
MATERIALS
LabQuest |
rubber-stopper assembly |
LabQuest App |
plastic tubing with two connectors |
Vernier Gas Pressure Sensor |
two 125 mL Erlenmeyer flasks |
Temperature Probe |
methanol |
four 1 liter beakers |
ethanol |
20 mL syringe |
ice |
PROCEDURE
1. Obtain and wear goggles! CAUTION: The alcohols used in this experiment are flammable and poisonous. Avoid inhaling their vapors. Avoid contacting them with your skin or clothing. Be sure there are no open flames in the lab during this experiment. Notify your teacher immediately if an accident occurs.
2. Use 1 liter beakers to prepare four water baths, one in each of the following temperature ranges: 0 to 5°C, 10 to 15°C, 20 to 25°C (use room temperature water), and 30 to 35°C. For each water bath, mix varying amounts of warm water, cool water, and ice to obtain a volume of 800 mL in a 1 L beaker. To save time and beakers, several lab groups can use the same set of water baths.
3. Prepare the Temperature Probe and Gas Pressure Sensor for data collection.
a. Connect the Gas Pressure Sensor to Channel 1 on LabQuest and the Temperature Probe to Channel 2. Choose New from the File menu. If you have older sensors that do not auto-ID, manually set up the sensors.
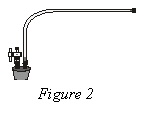
b. Obtain a rubber-stopper assembly with a piece of heavy-wall plastic tubing connected to one of its two valves. Attach the connector at the free end of the plastic tubing to the open stem of the Gas Pressure Sensor with a clockwise turn. Leave its two-way valve on the rubber stopper open (lined up with the valve stem as shown in Figure 2) until Step 8.
c. Insert the rubber-stopper assembly into a 125 mL Erlenmeyer flask. Important: Twist the stopper into the neck of the flask to ensure a tight fit.
4. On the Meter screen, tap Mode. Change the mode to Selected Events. Select OK.
5. The temperature and pressure readings should now be displayed on the screen. While the two-way valve above the rubber stopper is still open, record the value for atmospheric pressure in your data table.
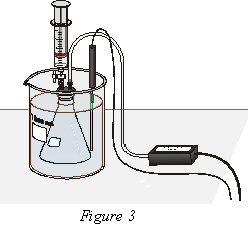
6. Finish setting up the apparatus shown in Figure 3:
a. Obtain a room-temperature water bath (20–25°C).
b. Place the Temperature Probe in the water bath.
c. Hold the flask in the water bath, with the entire flask covered as shown in Figure 3.
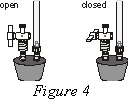
d. After 30 seconds, close the 2-way valve above the rubber stopper as shown in Figure 4—do this by turning the white valve handle so it is perpendicular with the valve stem itself.
7. Obtain the methanol container and the syringe. Draw 3 mL of the methanol up into the syringe. With the two-way valve still closed, screw the syringe onto the two-way valve, as shown in Figure 3.
8. Introduce the methanol into the Erlenmeyer flask.
a. Open the 2-way valve above the rubber stopper—do this by turning the white valve handle so it is aligned with the valve stem (see Figure 4).
b. Squirt the methanol into the flask by pushing in the plunger of the syringe.
c. Quickly return the plunger of the syringe back to the 3 mL mark of the syringe, then close the 2-way valve by turning the white valve handle so it is perpendicular with the valve stem.
d. Remove the syringe from the 2-way valve with a counter-clockwise turn.
9. Monitor and collect temperature and pressure data.
a. Start data collection.
b. The flask should still be submerged in the water bath.
c. When the temperature and pressure readings displayed on the screen have both stabilized, equilibrium between methanol liquid and vapor has been established. Tap Keep to store the temperature and pressure readings.
10. Collect another data pair using the 30–35°C water bath.
a. Place the Erlenmeyer flask assembly and the Temperature Probe into the 30–35°C water bath. Make sure the entire flask is covered.
b. When the temperature and pressure readings displayed on the screen have both stabilized, keep the second data pair.
11. For Trial 3, repeat the Step 10 procedure, using the 10–15°C water bath. Then repeat the Step 10 procedure for Trial 4, using the 0–5°C water bath. After you have collected the fourth and last data pair, stop data collection. Two graphs will be displayed, one with pressure vs. sample number and the other with temperature vs. sample number. Remove the flask and the Temperature Probe from the last water bath.
12. Open the side valve of the Gas Pressure Sensor so the Erlenmeyer flask is open to the atmosphere. Remove the stopper assembly from the flask and dispose of the methanol as directed by your teacher.
13. Change the axis values so that a graph of pressure vs. temperature will be displayed, then examine the displayed graph.
a. Choose Show Graph ►Graph 1 from the Graph menu.
b. Tap the x-axis label and choose Temperature.
c. To examine the data pairs on the displayed graph, tap any data point. As you tap each data point, the temperature and pressure values are displayed to the right of the graph. Examine the data points. Record the data pairs in your data table.
14. Obtain another clean, dry 125 mL Erlenmeyer flask. Draw air in and out of the syringe enough times that you are certain that all of the methanol has evaporated from it.
15. Determine the temperature and pressure values for ethanol at room temperature.
a. Repeat Steps 6–8 to do one trial only for ethanol in the room temperature water bath.
b. Tap the Meter tab.
c. Record the temperature value in the data table.
d. Monitor the pressure value. When the pressure reading in Channel 2 stabilizes, record its value in the data table.
16. Open the 2-way valve of the Pressure Sensor. Remove the stopper assembly from the flask and dispose of the ethanol as directed by your instructor.
PROCESSING THE DATA
1. Convert each of the Celsius temperatures to Kelvin (K). Record the answers.
2. To obtain the vapor pressure of methanol and ethanol, the air pressure must be subtracted from each of the measured pressure values. However, for Trials 2–4, even if no methanol was present, the pressure in the flask would have increased due to a higher temperature, or decreased due to a lower temperature (remember those gas laws?). Therefore, you must convert the atmospheric pressure at the temperature of the first water bath to a corrected air pressure at the temperature of the water bath in Trial 2, 3, or 4. To do this, use the gas-law equation (use the Kelvin temperatures):

where P1 and T1 are the atmospheric pressure and the temperature of the Trial 1 (room temperature) water bath. T2 is the temperature of the water bath in Trial 2, 3, or 4. Solve for P2, and record this value as the corrected air pressure for Trials 2, 3, and 4. For Trial 1 of methanol and Trial 1 of ethanol, it is not necessary to make a correction; for these two trials, simply record the atmospheric pressure value in the blank designated for air pressure.
3. Obtain the vapor pressure by subtracting the corrected air pressure from the measured pressure in Trials 2–4. Subtract the uncorrected air pressure in Trial 1 of methanol (and Trial 1 of ethanol) from the measured pressure.
4. Plot a graph of vapor pressure vs. temperature (°C) for the four data pairs you collected for methanol. Temperature is the independent variable and vapor pressure the dependent variable. Note: You can plot this graph using LabQuest App (see Steps 1–2 of the Extension that follows).
5. How would you describe the relationship between vapor pressure and temperature, as represented in the graph you made in the previous step? Explain this relationship using the concept of kinetic energy of molecules.
6. Which liquid, methanol or ethanol, had the larger vapor pressure value at room temperature? Explain your answer. Take into account various intermolecular forces in these two liquids.
DATA AND CALCULATIONS
Atmospheric pressure |
_______ kPa |
Substance |
Methanol |
Ethanol |
|||
Trial |
1 |
2 |
3 |
4 |
1 |
Temperature |
|
|
|
|
|
Temperature |
|
|
|
|
|
Measured |
|
|
|
|
|
Air pressure (kPa) |
no correction |
corrected |
corrected |
corrected |
no correction |
|
|
|
|
|
|
Vapor pressure (kPa) |
|
|
|
|
|
EXTENSION
The Clausius-Clapeyron equation describes the relationship between vapor pressure and absolute temperature:
ln P = ∆Hvap / RT + B
where ln P is the natural logarithm of the vapor pressure, ∆Hvap is the heat of vaporization, T is the absolute temperature, and B is a positive constant. If this equation is rearranged in slope-intercept form (y = mx + b):
the slope, m, should be equal to –∆Hvap / R. If a plot of ln P vs. 1/T is made, the heat of vaporization can be determined from the slope of the curve. Plot the graph on the LabQuest:
1. Prepare LabQuest for data entry.
a. Disconnect the sensors and choose New from the File menu on the Meter screen.
b. Tap the Table tab to view the data table.
c. Choose Data Column Options ►X from the Table menu.
d. Enter the Name (Temp) and the Units (°C). Select OK.
e. Choose Data Column Options ►Y from the Table menu.
f. Enter the Name (Pressure) and the Units (kPa). Select OK.
2. Enter the temperature (°C) and vapor pressure values.
a. Tap the first cell in the Temperature column and enter the lowest temperature value you recorded in the data table.
b. Tap to the first cell in the Pressure column and enter the corresponding vapor pressure value.
c. Continue with this process, entering the data pair with the next highest temperature value, until you have entered all four of the data pairs for this experiment.
3. Create a column of reciprocal of Kelvin temperature. During this process, you will add 273 to each of the Celcius temperatures you entered in Step 2 and then calculate the reciprocal of those values.
a. Choose New Calculated Column from the Table menu.
b. Enter the Name (1/Kelvin) and the Units (1/K). Select the equation, A/(B+X). Use Temperature(C) as the Column for X. Enter 1 as the value for A and enter 273 as the value for B.
c. Select OK.
4. Create a column of the natural log (ln) of vapor pressure values in a new column.
a. Tap Table to display the data table.
b. Choose New Calculated Column from the Table menu.
c. Enter the Name (ln Press) and leave the Units field blank. Select the equation, AlnX. Select Pressure (kPa) as the Column for X. Enter 1 as the value for A.
d. Select OK.
5. Follow this procedure to calculate regression statistics and to plot a best-fit regression line on your graph of ln pressure vs. reciprocal of Kelvin temperature:
a. Choose Curve Fit from the Analyze menu.
b. Select Linear as the Fit Equation. The linear-regression statistics for these two lists are displayed for the equation in the form:
y = mx + b
where x is 1 / Kelvin temperature, y is ln vapor pressure, b is the slope, and b is the y-intercept. Record the value of the slope, m, to use in calculating the heat of vaporization in the next step.
c. Select OK. Examine your graph to see if the relationship between ln pressure vs. 1/ Kelvin temperature is linear.
d. (optional) Print a copy of the graph.
6. Use the slope value you recorded in the previous step to calculate the heat of vaporization for methanol (m = –∆Hvap / R).